Disclaimer
The results obtained from these calculators are for general purposes only to illustrate the effect of compound interest and are not intended as a substitute for professional financial advice. Before making any financial decisions on the basis of these results, you will need to consult with an independent financial planner or accountant as well as consider whether the advice is suitable to meet your personal financial objectives and circumstances.
The actual performance of any investments will depend on future economic conditions, investment management, fees and taxation. Past performance is no guarantee of future performance and as a result of this, all the results are hypothetical and are NOT GUARANTEED.
Nambawan Super specifically disclaims any liability for any direct, indirect, incidental, consequential or special damages arising out of or in any way connected with the access to or use of these calculators. To the extent permitted by law, under no circumstances will Nambawan Super be liable for any loss or damage caused by a user's reliance on the information by using these calculators.
Assumptions
Projected super balance at retirement:
The projected total super balance takes into account your starting balance, employee and employer contributions, any additional voluntary contributions as well as interest earned between now and your retirement.
Retirement age:
We have assumed a default retirement age of 65. This can be adjusted in the calculator.
Working life:
The calculator assumes that you will have a continuous working life with no breaks up to your retirement age.
Interest rate:
The default investment returns have been set at 6.0%. This is based on the Nambawan Super 10-year average interest rate.
Employee contributions:
PNG Superannuation laws dictate that 6% is the mandatory minimum contribution for employees to make. Employees may choose to contribute more than the minimum.
Employer contributions:
PNG Superannuation laws dictate that 8.4% is the mandatory minimum contribution that employers have to make. Employers may choose to contribute more than the minimum.
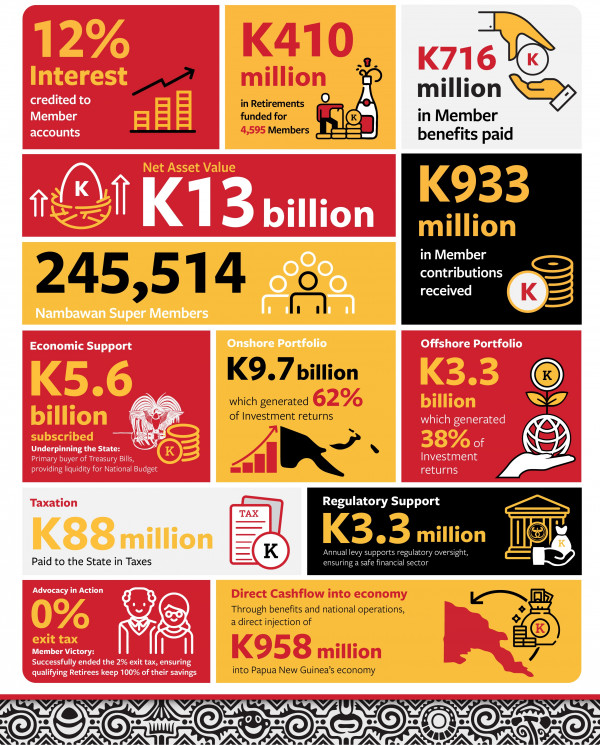
At 31 December 2025, our strategic approach to investments has contributed to Nambawan Super Limited's success over the years resulting in making us the largest superannuation fund in PNG by assets under management, currently worth over K13 billion.
What is NSL's Crediting Rate?
 At NSL, the Members' superannuation investment return is determined by a Crediting Rate.
Ideally, the Members' crediting rate is equal to NSL's Net Profit After Tax, after allowing for any reserves (if applicable). This is referred to as Net Surplus Available to Members, which is then distributed to all Members of the Fund.
NSL determines an Annual Crediting Rate early each calendar year which is applied to the Member account balances retrospectively for the period from 1 January to 31 December of the previous year.
NSL also determines and applies an Interim Crediting Rate in the event that a Member exits the Fund, such that the Member's final entitlement includes an earnings rate for the period from the most recent Annual Crediting Rate till the date of exit.
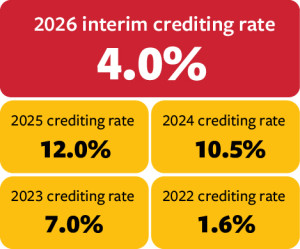
Nambawan Super's current Interim Crediting Rate stands at 4.0% (as of 11 June 2026)
You can read Nambawan Super's Crediting Rate Policy here.
Updates from the most recent Financial Results declaration
Nambawan Super delivered the following results to Members in 2025;
- Fund Membership grew by 4.1% to 245,514 Members, from 235,888 in 2024;
- Net Asset Value now totals K13 billion, an increase of K1.8 billion compared to K11.2 billion in 2024.
- Net Profit After Tax a record-high of K1.4 billion, representing a significant increase of K300 million from the 2024 NPAT of K1.1 million.
- Annual interest rate of 12% return for Members compared to 10.5% in 2024.
- Member Contributions Received totalled K933 million, compared to K961 million in 2024.
- Member Benefits Paid totalled K716 million paid out through Exits such as resignation; retirement, Death Benefit Payments, Transfers, Unemployment Benefits, Housing Advances and RSA Withdrawals to Members and or Member Beneficiaries, compared to K703 million paid out in 2024.
Chairman of Nambawan Super Richard Sinamoi said the Fund remained focused on its core responsibility of protecting and growing the retirement savings of its Members despite ongoing economic pressures, including global inflation, geopolitical tensions, and local business challenges such as law and order issues, access to foreign currency and unreliable utilities.
“Nambawan Super has continued to deliver strong outcomes for our Members through disciplined investment management, prudent governance and the dedication of our Board, Management and staff,” Mr. Sinamoi said.
What results are important for Members?
In addition to the successful 2025 results that that Chairman has announced, NSL continues to deliver positive outcomes for our Members such as:
- A total of K52 million in State Share Benefits paid out.
- A total of K115 million in Housing Advance paid out to support 5,536 Members purchase, build or improve their homes; and,
- A total of K716 million was paid out through Exits, Normal & Death Benefit Payments, Transfers, Unemployment Benefits, Housing Advances and RSA Withdrawals to Members and Member Beneficiaries.
We are extremely proud that amidst all the challenges, we are able to promptly process and payout Members when they are ready to retire.
Even with these higher value Member exits, the Fund continues to deliver strong growth in Membership numbers year on year, demonstrated once again in 2025 when we welcomed 9,600 Members.
What does NSL's performance look like over the last five years?
Over the last five years, NSL has produced the following results:
- Generated over K3.8 billion in profit for Members;
- Grew Members' Net Assets by K4 billion;
- Grew the Average Wealth per Member by 34%;
- Delivered an average interest of 7.52%; and
- Paid nearly K4 billion in Benefit Payments to Members.
A detailed overview of financial results can be seen in the Statistical Summary table below.
|
|
|
2025 |
2024 |
2023 |
2022 |
2021 |
|
Profitability |
||||||
|
Total Investment Income |
K(m) |
1,649 |
1,298 |
858 |
351 |
737 |
|
Total Expenses |
K(m) |
199 |
150 |
137 |
129 |
130 |
|
Income Tax Expense |
K(m) |
88 |
64 |
62 |
78 |
81 |
|
Net Profit after Tax |
K(m) |
1,362 |
1,085 |
659 |
144 |
526 |
|
Balance sheet |
||||||
|
Net Assets |
K(m) |
12,760 |
11,181 |
9,839 |
8,991 |
8,823 |
|
Net Asset Growth |
% |
14.1 |
13.6 |
9.4 |
1.9 |
8.4 |
|
Reserves |
K(m) |
71 |
74 |
56 |
45 |
42 |
|
Reserves as a percentage of Net Assets |
% |
0.5* |
0.7 |
0.6 |
0.5 |
0.5 |
|
Return to Members |
||||||
|
Interest Credited to Members |
% |
12.0 |
10.5 |
7.0 |
1.6 |
6.5 |
|
Headline Inflation Rate |
% |
4.0 |
3.2 |
3.5 |
6.3 |
5.7 |
|
Real Return to Members |
% |
8.0 |
7.3 |
3.5 |
-4.7 |
0.8 |
|
Membership |
||||||
|
Number of Members |
|
245,514 |
235,888 |
228,319 |
220,410 |
214,540 |
|
Average Wealth Per Member |
K |
51,973 |
47,400 |
45,067 |
40,792 |
38,689 |
|
Number of RSA Members |
|
7,305 |
6,947 |
6,818 |
6,643 |
5,584 |
|
Number of Choice Super Members |
|
24,014 |
23,128 |
21,478 |
20,211 |
19,194 |
|
Number of Members making Voluntary Contributions |
|
38,380 |
35,777 |
33,780 |
31,614 |
30,391 |
|
Number of Pensioners |
|
250 |
240 |
672 |
674 |
674 |
|
Member contribution & payouts |
||||||
|
Contributions received |
K(m) |
933 |
961 |
970 |
1,025 |
827 |
|
Gross Exit Payouts |
K(m) |
716 |
703 |
781 |
1,002 |
645 |
|
Total Pension Payments |
K(m) |
1.6 |
1.7 |
1.6 |
1.9 |
1.8 |
|
Total Benefit Payments made |
|
32,810 |
30,028 |
30,998 |
30,108 |
26,487 |
|
Trustee expenses |
||||||
|
Management Expenses |
K(m) |
122 |
98 |
87 |
77 |
81 |
|
Investment and Administration Expenses |
K(m) |
77 |
53 |
51 |
52 |
49 |
|
Number of Staff |
|
252 |
250 |
228 |
205 |
192 |
